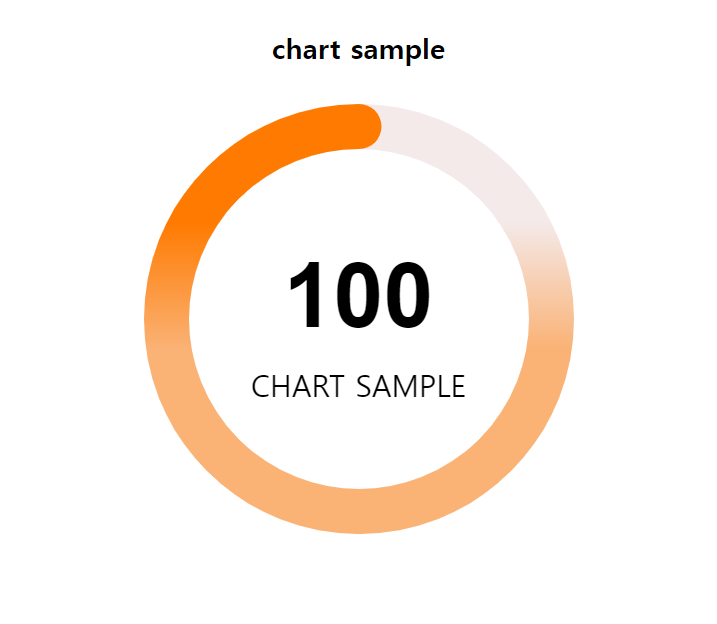
SVG 도넛차트
도넛 모양의 차트를 구현한 일이 있었는데,
디자인 상의 그라데이션과 100% 채워졌을때의 디자인이 일반 SVG 도넛차트와 달라서 여러 방법으로 테스트를 하던 중,
비슷한 라이브러리를 찾아 구현할 수 있었다.
1
2
3
4
5
6
7
8
9
10
11
12
13
14
15
16
17
18
19
20
21
22
23
24
25
26
27
28
29
30
31
32
33
34
35
36
37
38
39
40
41
42
43
44
45
46
47
48
49
50
51
52
53
54
55
56
57
58
59
60
61
62
63
64
65
66
67
68
69
70
71
72
73
74
75
76
77
78
79
80
81
82
83
84
<!DOCTYPE html>
<html lang="ko">
<head>
  <meta charset="UTF-8">
  <meta http-equiv="X-UA-Compatible" content="IE=edge">
  <meta name="viewport" content="width=device-width, initial-scale=1.0">
  <title>Radial/Ring/Circle Progress Chart Generator for Apple Watch.</title>

  <style>
    body{ padding: 0; margin:0; text-rendering: optimizelegibility; }
    .charts-item { text-align: center; }
    .chart-box { position:relative; height:300px; width:300px; margin: 10px auto;}
    .chart-options { padding: 5px 0; }
    .knob.with-subtext {margin-top: 85px !important;}
    .subtext {position: absolute; width: 100%; text-align: center; text-transform: uppercase; top: 180px; font-size: 20px;}
  </style>
  <script src="https://code.jquery.com/jquery-3.6.2.js" crossorigin="anonymous"></script>
  <script src="https://cdnjs.cloudflare.com/ajax/libs/jquery-easing/1.4.1/jquery.easing.min.js"></script>
  <script src="jquery.knob.js"></script>
  <script>
    (function(i,s,o,g,r,a,m){i['GoogleAnalyticsObject']=r;i[r]=i[r]||function(){
    (i[r].q=i[r].q||[]).push(arguments)},i[r].l=1*new Date();a=s.createElement(o),
    m=s.getElementsByTagName(o)[0];a.async=1;a.src=g;m.parentNode.insertBefore(a,m)
    })(window,document,'script','//www.google-analytics.com/analytics.js','ga');

    ga('create', 'UA-60593416-1', 'auto');
    ga('send', 'pageview');
  </script>
</head>
<body>
  <div class="charts-item">
    <h3>chart sample</h3>
    <div id="single-arc" class="chart-box">

      <div class="canvas-box">
        <input id="single-single-arc" class="knob with-subtext"
          data-min="0"
          data-bgColor="#F4F6F9" data-fgColor="#F4EAEA" data-fgColorMid="#fab275" data-fgColorEnd="#ff7a00"
          data-displayInput="true"
          data-width="300" data-height="300"
          data-thickness=".2" data-bgthickness=".2"
          data-angleOffset="0" data-linecap="round"
          data-readOnly="false"
          data-inputColor="#000000"
          data-shadow="false" data-shadowColor="#000000"
          data-step="0.1"
          value="0"
          data-max="100"
          rel="100"
        >
        <div class="subtext">chart sample</div>
      </div>
    </div>
  </div>

  <script>
    window.addEventListener("load", ()=>{
      // $(".knob").each(()=>{
      let $this = $(".knob");
      let myVal = $this.attr("rel");
      $this.knob();

      $({
        value: 0
      }).animate({
        value: myVal
      }, {
        duration: 2000,
        // easing: 'easeOutQuad',
        easing: 'easeOutCubic',
        // easing: 'easeOutQuart',
        // easing: 'easeOutQuint',
        // easing: 'easeOutExpo',
        step: function () {
          // $this.val(Math.ceil(this.value)).trigger('change');
          $this.val((this.value).toFixed(2)).trigger('change');
          $this.val((this.value).toFixed(0));
        }
      })
      // });
    })
  </script>
</body>
</html>
참고
This post is licensed under CC BY 4.0 by the author.